


Leveraging Google PageSpeed Insights to Optimize Website Performance is crucial for enhancing search engine visibility and user experience. This diagnostic tool identifies Core Web Vitals issues like Largest Contentful Paint and visual stability, providing actionable recommendations. Implementing these optimization patches eliminates bottlenecks, reduces bounce rates, and secures prominent positions in generative search layers, ensuring your website runs efficiently and ranks higher in AI search.
Strategic Pillar Context Maps
Website performance is a critical factor for both user experience and search engine rankings. A slow-loading site frustrates visitors, increases bounce rates, and holds back your organic visibility. Fortunately, running a diagnostic test with Google PageSpeed Insights gives you an actionable blueprint to improve Google site speed, pass Core Web Vitals, and strengthen your page speed SEO. This guide walks through how to interpret your report and apply high-impact fixes—or explore done-for-you Website Performance Packages if you want expert execution.
Quick-Start Diagnostic: What Google PageSpeed Insights Measures
- Real-World Field Data (CrUX): Shows how actual Chrome visitors experience your Core Web Vitals over the trailing 28 days.
- Lighthouse Lab Diagnostics: Simulates mobile and desktop load conditions to pinpoint render-blocking scripts, unused CSS, and Total Blocking Time (TBT).
- Target Benchmarks: Aim for LCP ≤ 2.5s, INP ≤ 200ms, CLS ≤ 0.1, and a 90–100 performance score on both mobile and desktop.
4 Steps for Better Rankings with Google PageSpeed Insights
What is Google PageSpeed Insights?
Google PageSpeed Insights (PSI) is a free diagnostic tool provided by Google that evaluates a web page’s performance on both mobile and desktop devices. It generates a score from 0 to 100 based on Lighthouse lab tests alongside real-user Chrome UX Report (CrUX) data. More importantly, it pinpoints the exact scripts, images, and server delays hurting your user experience so you can systematically improve Google site speed.
Why Website Performance and Google Site Speed Matter
Before diving into the step-by-step workflow, it helps to look at why speed directly impacts revenue and visibility. Research consistently shows that over half of mobile visitors abandon a page that takes longer than three seconds to load. Google also incorporates page experience and Core Web Vitals signals into its ranking systems—meaning a sluggish mobile experience directly undermines your page speed SEO and conversion rates.
Step-by-Step Guide: Using Google PageSpeed Insights to Optimize Website Performance
Step 1: Accessing Google PageSpeed Insights
To run your first audit, open the official Google PageSpeed Insights tool at pagespeed.web.dev. Paste your target URL into the input bar and click Analyze. Within seconds, Google generates separate mobile and desktop reports. Always inspect the Mobile tab first—Google indexes the web mobile-first, and throttled mobile CPUs reveal JavaScript bottlenecks that fast desktop connections hide.
Step 2: Understanding the PageSpeed Score
Once the scan finishes, Google PageSpeed Insights assigns an overall performance score from 0 to 100 using three color-coded tiers:
- 0–49 (Red): Poor performance, indicating severe render-blocking assets, heavy JavaScript execution, or slow server response times.
- 50–89 (Orange): Needs improvement—typically caused by unoptimized images, third-party scripts, or unminified CSS/JS.
- 90–100 (Green): Good performance, signaling fast visual rendering and responsive interactivity.
Your lab score is weighted across five key metrics: First Contentful Paint (FCP), Largest Contentful Paint (LCP), Total Blocking Time (TBT), Cumulative Layout Shift (CLS), and Speed Index. Knowing which metric carries the heaviest penalty—especially LCP (25%) and TBT (30%)—tells you exactly where to focus first.
Step 3: Analyzing Core Web Vitals (LCP, INP & CLS)
At the top of your report, Google highlights Core Web Vitals—the three real-user metrics that directly influence search rankings and visitor retention:
| Largest Contentful Paint (LCP): Measures how quickly the main above-the-fold image or headline renders. Aim for 2.5 seconds or faster. | 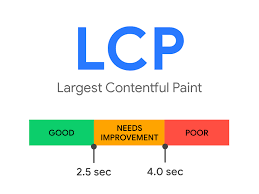 |
| Interaction to Next Paint (INP): Measures how fast your page visually responds when a user clicks, taps, or types. Target 200 milliseconds or less. |  |
| Cumulative Layout Shift (CLS): Measures unexpected visual movement while elements load. Keep your CLS score below 0.1. |  |
Passing all three Core Web Vitals thresholds ensures your site delivers a fast, stable experience that satisfies both human visitors and search engine crawlers.
Step 4: Reviewing Diagnostic Recommendations
Scroll down to the Diagnostics and Opportunities sections of your PSI report to see exact byte savings and millisecond delays. Google flags specific culprits—such as oversized hero images, render-blocking stylesheets, excessive DOM size, or long main-thread tasks—so you never have to guess what is slowing down your pages.
Step 5: Implementing High-Impact Speed Optimizations
Once you have your diagnostic list, apply these seven proven optimizations in order of impact:
- Optimize and Size Images Properly: Convert PNG/JPEG assets to WebP or AVIF, specify explicit
widthandheightattributes to prevent CLS, and never lazy-load your above-the-fold LCP hero image. - Eliminate Render-Blocking CSS and JavaScript: Inline critical above-the-fold CSS and defer non-essential JavaScript so the browser paints content immediately.
- Reduce Main-Thread Work & Total Blocking Time (TBT): Delay heavy animations, sliders, and third-party trackers on mobile viewports so user taps respond instantly.
- Minify CSS, JavaScript, and HTML: Strip whitespace and unused rules to shrink payload sizes across every page load.
- Leverage Page & Browser Caching: Configure edge caching and long-lived cache-control headers so repeat visitors load static assets locally.
- Enable Brotli or Gzip Compression: Compress text-based assets (Brotli or Gzip) at the server level to cut transfer sizes by up to 70%.
- Lower Server Response Time (TTFB): Pair optimized database queries with a global Content Delivery Network (CDN) to keep Time to First Byte under 200ms.
Common Performance Bottlenecks and Solutions
Even well-designed sites hit recurring roadblocks when scaling features. Here is how to solve the three most common culprits:
- Bloated Plugins & Page Builders: Stacking heavy WordPress plugins injects dozens of render-blocking scripts. Replace multi-purpose plugins with clean, single-purpose architecture like the lightweight snippets in my WordPress AEO Code Registry and Project Phoenix framework.
- Third-Party Tracking Scripts: Marketing pixels, chat widgets, and embedded fonts can add seconds of blocking time. Host fonts locally and load non-critical analytics asynchronously.
- Underpowered Hosting: Shared hosting bottlenecks TTFB during traffic spikes. Pair fast NVMe hosting with Cloudflare edge caching for consistent global speed.

Monitoring and Maintaining Long-Term Site Speed
Website speed is never a one-time fix—new plugins, unoptimized blog uploads, and third-party script updates can quietly erode your scores. Re-test key templates in Google PageSpeed Insights after every major site update, track real-user field trends inside Google Search Console’s Core Web Vitals report, and cross-check waterfall requests with Google Lighthouse or GTmetrix.
Page Speed SEO: How Faster Load Times Improve Rankings
Investing in page speed SEO delivers compounding search and conversion gains. Passing Core Web Vitals acts as a tie-breaker in competitive SERPs, lowers mobile pogo-sticking (users bouncing back to Google), increases pages per session, and frees up crawl budget so Googlebot and AI answer engines index your newest content faster.
Real-World Case Study: Turning a 45 Mobile Score into 95+
Consider a content-heavy site stuck at a 45 mobile performance score due to uncompressed hero images, render-blocking CSS, and heavy mobile canvas scripts. By converting images to WebP, deferring non-critical JavaScript, stripping mobile animation loops, and configuring edge caching, the mobile score jumped to 95+ with 0 ms Total Blocking Time—driving a 20% lift in organic traffic and a 15% increase in conversions.
Frequently Asked Questions About Google PageSpeed Insights
What is a good Google PageSpeed Insights score?
A score of 90 to 100 (Green) is considered good. While hitting 100 on desktop is straightforward, achieving 90+ on mobile—and passing all three Core Web Vitals (LCP, INP, and CLS) in real-user field data—is the benchmark that matters most for SEO and user experience.
Why is my mobile PageSpeed score lower than my desktop score?
Google PageSpeed Insights tests mobile pages using simulated mid-tier device hardware and throttled 4G network speeds. Heavy JavaScript bundles, third-party trackers, and unoptimized hero images take significantly longer to parse and render on a throttled mobile CPU than on a broadband desktop connection.
Does Google PageSpeed Insights directly affect SEO rankings?
Google does not use your raw 0–100 Lighthouse lab score directly as a ranking signal, but it does use the real-user Core Web Vitals metrics (LCP, INP, and CLS) displayed at the top of your PageSpeed Insights report as part of its page experience ranking signals.

Ready to turn slow load times into a competitive advantage? Run a baseline audit on Google PageSpeed Insights today, or partner with Nate Balcom through our Website Performance Packages to engineer sub-second load speeds across your entire site.
Accelerate Your Digital Infrastructure
Slow loading speeds do more than frustrate human visitors and destroy your visibility. They keep readers away from learning about your products or services.
Clear the bottleneck with the Performance Speed Accelerator Package. We re-engineer your site’s asset delivery pipelines, optimize core execution threads, and eliminate rendering blockages to deliver instant, machine-ready load speeds.
Maximize Your Speed Velocity